WinzeWinze

Product · Processing

Trace a throughput drop to the asset that caused it.

Winze knows what feeds what in your circuit. When throughput falls it walks upstream, tests what moved first and by how long, remembers whether it has seen this before, and watches the assets that are drifting before they stop the plant.

Built for

  • Processing Manager
  • Metallurgists
  • Maintenance & Reliability, fixed plant

Conversations with Processing Manager and Maintenance & Reliability Superintendent

Processing Manager

Owns throughput and recovery across the circuit · Winze chat

Illustrative

Why did SAG throughput drop on Thursday night?

$58K

lost throughput · SAG ran 3.1 h below rate

Pebble recycle surged; SAG ran 3.1 h below rate.

  • 22:40 pebble crusher went to bypass; recycle load up 38%.
  • SAG feed rate fell 20 min later (lagged correlation 0.86).
  • Lost throughput: $58K.

Has this happened before?

Twice since connection, both after a pebble crusher bypass.

  • Flow graph traces upstream
  • Correlation with lag
  • Memory of past incidents

Maintenance & Reliability Superintendent

Keeps fixed plant running · Winze chat

Illustrative

Is the ball mill cyclone feed pump drifting?

+6 °C

bearing temperature since 14 Sep · no dollars lost yet

Yes: bearing temperature up 6 °C since 14 Sep.

  • Change point against its learned baseline; vibration rising too.
  • FT-210 flatlining is an instrument fault, not the process.
  • Still at full rate: no dollars lost yet.

Watch it every shift and tell me if it climbs.

Scheduler set: checks every shift, alerts you at +3 °C more.

  • Anomalies and change points
  • Instrument faults flagged
  • Scheduler watch every shift

Illustrative conversation. Figures are examples, not customer data.

What it does for Processing

Throughput traced to cause.

01

Upstream through the flow graph

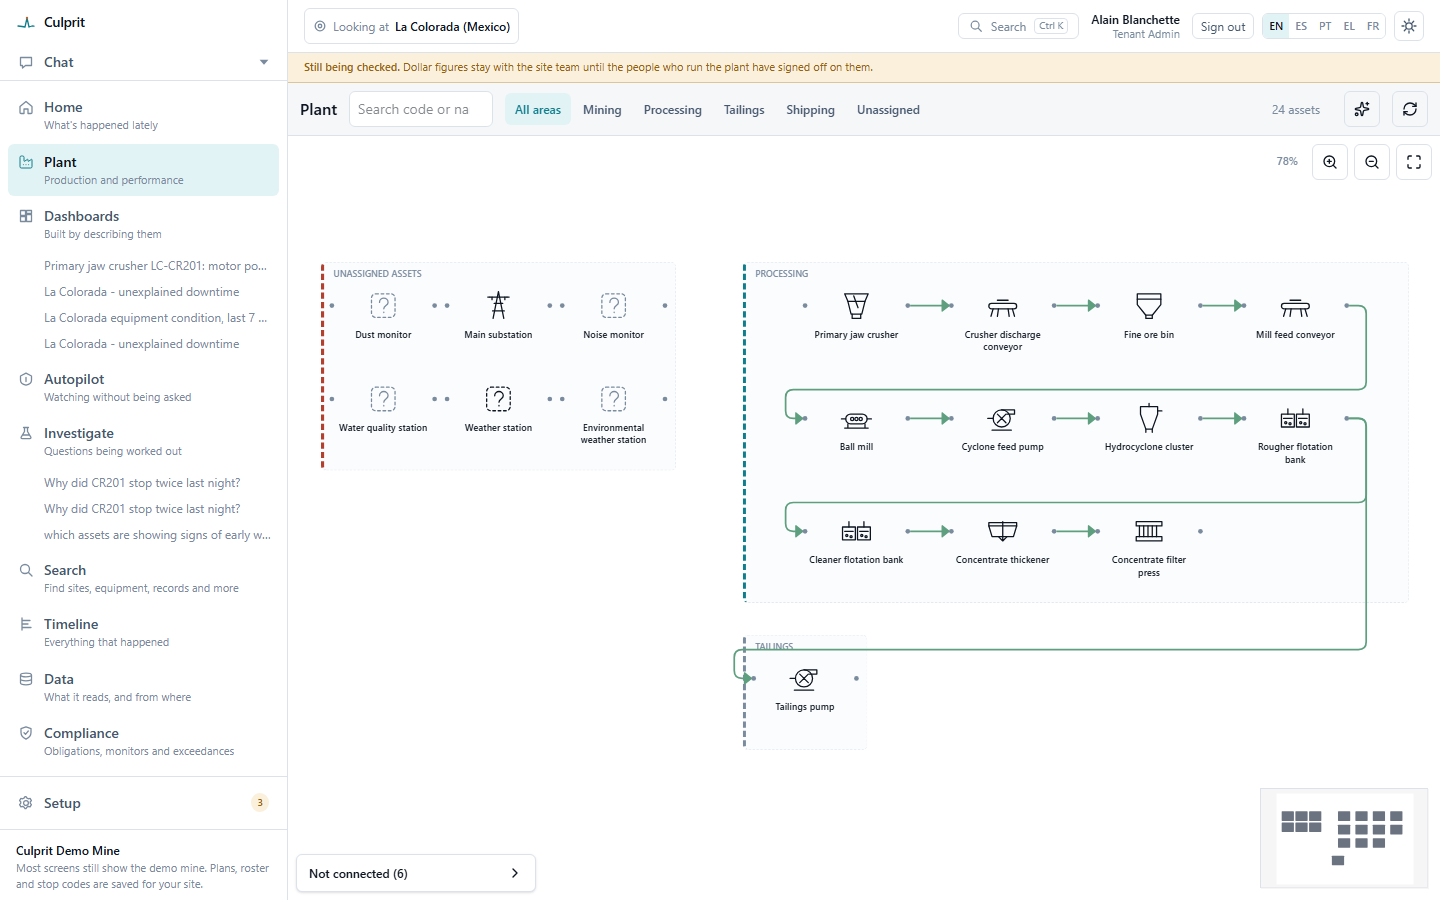
It learns what feeds what from how equipment starts, stops and loads, with a confidence on every link, or reads it from the hierarchy you already keep in PI AF or Ignition. A drop at the mill is traced back up the circuit to where it started.

Plant: 24 assets drawn as a flowsheet, from the primary jaw crusher through grinding and flotation to the concentrate thickener and filter press, with six unassigned assets named
The circuit as Winze holds it: what feeds what, from the crusher to the filter press.

02

Lagged correlation, and a memory

It tests which signal moved first and how long before the next one followed. Every investigation is recorded (hypothesis, method, data, result) and earlier runs and incidents are recalled, so a repeat is recognised and ground is never covered twice.

Tools at its disposal, budgeted on every run
Statistics
Mean, median, spread, distribution comparison, operating-state clustering
Correlation
Pearson, with lag detection
Anomalies
Robust outliers, change points, learned baselines
Context
Signal queries, plant-graph and ontology traversal

03

Drift caught before the stop

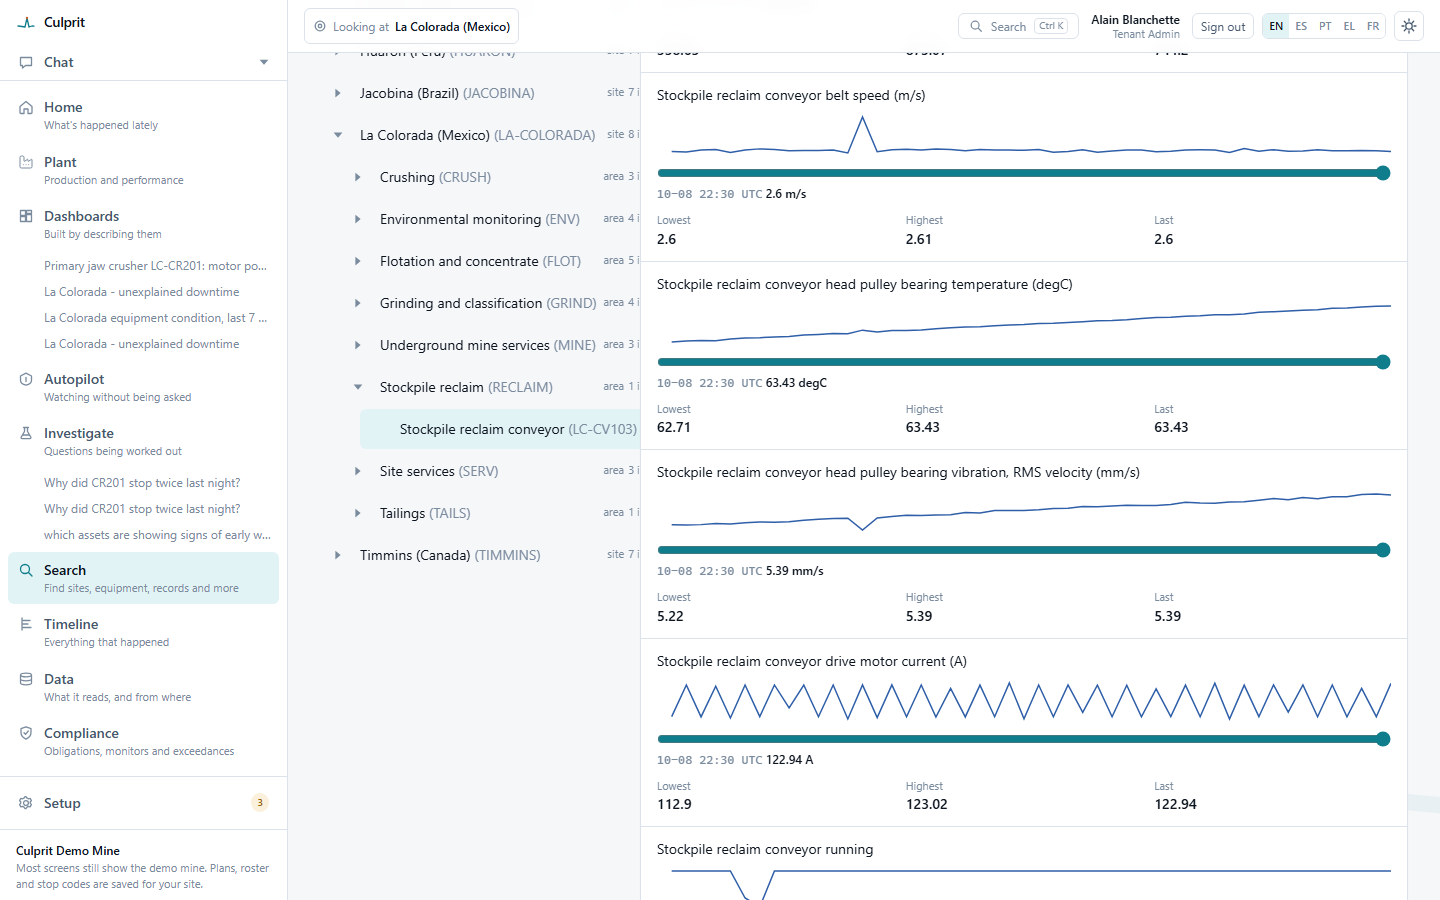
Change points against each asset’s learned baseline catch a bearing that is warming or a vibration that is climbing while the plant is still at full rate. A transmitter that flatlines is flagged as an instrument fault, not read as the process.

A stockpile reclaim conveyor’s live readings: belt speed, head pulley bearing temperature and bearing vibration, both rising gently, and drive motor current, each with its lowest, highest and last value
One conveyor’s live readings in the demo tenant: bearing temperature and vibration, each over its window.

04

Metal lost to tailings, priced

A metallurgist should not find product loss at month end. From your feed, concentrate and tailings assays and the tonnes your mill-feed weightometer made, Winze says how much metal went to tailings, how far recovery fell short of the budget you set, and what the shortfall is worth, for any week or month. Where a stream has no weightometer its tonnes are derived by mass balance and the answer says so; your best sustained recovery is learned from your own weeks, never a number someone else chose.

How the shortfall is counted
  1. 01Three assaysFeed, concentrate and tailings, from your lab
  2. 02Metal to tailingsWhat the tailings carried away, by mass balance
  3. 03Against your budgetHow far recovery fell short of the budget you set
  4. 04PricedThe shortfall at your metal price and payability

What it reads

The signals and sources behind every answer.

Read-only by design: nothing writes to your control systems.

  • Mill power, feed rates and recycle loads

    From the OPC-UA server already on site, read-only.

  • Bearing temperatures, vibration and flow transmitters

    Each against its own learned baseline.

  • Lab results

    From a spreadsheet, a daily export or an SFTP drop.

  • Your plant hierarchy

    From PI AF or Ignition, where you already have one.

Next step: a pilot on one site.

See it on your own plant. Book a pilot and we’ll run it with you on one site: the unexplained loss on your plant, priced, with its evidence.

  1. 01

    Connect one site

    OPC-UA, read-only, one command on site

  2. 02

    Run it for 90 days

    Chat, shift reports and Scheduler tasks

  3. 03

    Review the findings together

    The unexplained loss, priced, with its evidence

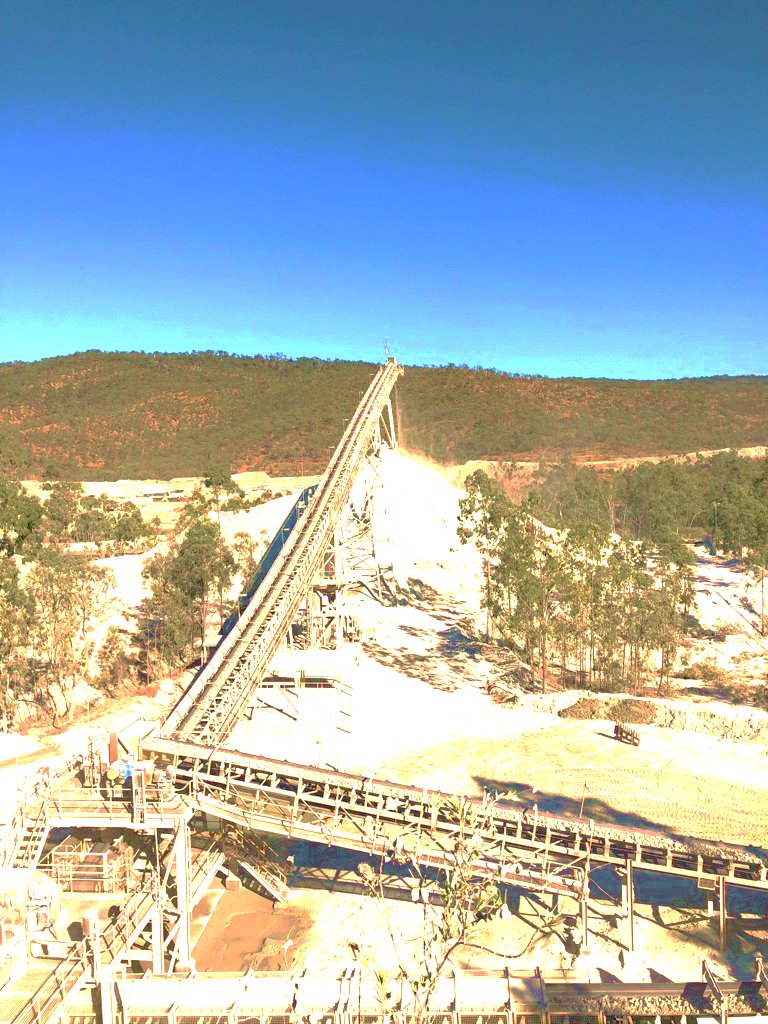
A conveyor running up from a processing plant at a mine site